
Introducing the Tom Model: Simulating the Results of the 2024 CONCACAF Nation's League Final
Using Analytic Formulae and Elo Ratings to Simulate Soccer Tournaments

Soccer matches are crazy, unpredictable events. There are so many variables that go into winning a match, and anything can happen on any given day. The chaotic, unpredictable nature of the game is part of the allure of the sport for many people, leaving them on the edge of their seats during the most tense moments of huge matches.
The highly-variable nature of soccer makes it hard even for experts to predict exactly what will happen in a match. Entire industries have developed that aim to assess player and team talent, rate teams based on performances, and use data to predict the results of matches. Metrics and ratings systems have been created, data has been aggregated, and code has been written to help de-mystify the future in the sport and predict outcomes ahead of time.
Most soccer predictive models are complex, and the specific details that make them accurate are kept as secretive as possible in order to preserve crucial competitive advantages. However, not all mathematical models need to be this complex. It is possible to make a simple model that provides a rough prediction of how a soccer tournament will play out.
When the United States was attempting to qualify for the 2022 World Cup, I started playing around with simple modeling in order to ease my anxiety about their chances of qualification. From this exercise in fear management was born the Tom Model, my simple predictive model for international soccer. The Tom Model has expanded greatly since its inception, becoming a predictive tool for World Cups, Gold Cups, World Cup qualification campaigns, and more. In this piece, I want to give a brief introduction to how the model works, the math behind it, and the importance of the Elo Ratings that the model relies on.
Understanding Elo Ratings
Elo ratings are a results-based metric that estimate the strength of a competitor in any competition based on their previous ranking and their recent performances. The basic idea behind the ratings is that the actual performance of a competitor is subject to statistical variance for any given match, but the skill level of said competitor is much more constant. Good players and teams have bad days. Bad players and teams have good days. On any given day, any number of upsets may happen, but if you play the same match 10 times, the better player or team will win more of them on average.
This rating system was first envisioned as a way to rank chess players based on their performances by a physicist named Arpad Elo1 in the 1950’s. His new formulae were quickly adopted as an official rating system by the United States Chess Federation in 1960 and the World Chess Federation in 1970. Elo ratings work by starting every player from the same rating value. Every time two competitors face off, points are exchanged between competitors with the winner taking points from the loser. The number of points exchanged depends on the rating of each player before the match began. After many matches have been played, the better players rise to higher rating values by winning more matches on average.
Since the Elo model first became popular in chess, its use has spread rapidly. While the system was originally designed for chess, it works as a rating metric for any competition in which individual matches are played. Soccer is no exception. Elo ratings can be used to judge the quality of any soccer team in comparison to their regular competitors. It is particularly useful for international soccer as friendlies and World Cups give a chance for Elo points to be exchanged by teams around the world, not just within confederations.
In soccer, the formulae are modified slightly to account for goal difference, venue, and competition level. The idea behind these changes are that better teams win games by a larger margin, teams generally play better at home, and winning games in the most important matches is a sign of team quality. The website eloratings.net can be used to view the current Elo ratings of every national team and the historical changes for each nation dating back to their very first match. A helpful breakdown of the calculations can also be found on the site.
About the Tom Model
The Tom Model is my attempt to use international soccer Elo ratings in order to predict the results of major tournaments. The actual model itself is very simple. It relies on the Win Expectancy value for any given match that is given on the soccer Elo Ratings website. The Win Expectancy for a team in a given match is:
where dr is the difference in Elo rating between each team with 100 points added to the team with home field advantage.
Unfortunately, Win Expectancy is a binary quantity. It only tells you how often a team will win or lose a match. Draws are not accounted for. Thankfully, mathematicians solved this problem long ago. Davidson (1970) created three new formulae that turn the Win Expectancy for both teams in a match into the probability of a win, loss, or draw:
The only undefined parameter that is introduced here is θ, which is a “draw parameter” that can be set to any value. I have generally found that 1.7 is the value that gives the most realistic result.
Once you know the Elo Rating of both teams and the location of the game, it is possible to calculate the probability of any result in an upcoming match. It also becomes possible to “simulate” the outcome of any match. You do this by using a weighted random number generator to randomly pick a winner or a draw based on your calculated probabilities. Repeating this process for every match in a tournament gives you a single possible outcome of the tournament. Simulating an entire tournament 10,000 times using this method will allow you to determine the most likely outcome of the tournament and tell you how likely every team is to progress to every round.
These methods give you a baseline estimate of what the most probable outcomes are, but they are inherently slow to track sudden changes. If a star player is hurt or a team doesn’t play their best team, then the Tom Model will not account for that. If a team suddenly develops a new crop of young talent or gets a new coach that changes their fortunes, then the Tom Model will be slow to respond to that. All that we have to work off of are the most recent results.
2024 CONCACAF Nation’s League Finals
It can be hard to grasp the complexities of any model without seeing an example of how it works. Thankfully, we are less than 3 weeks away from the Finals of the 2023-2024 CONCACAF Nation's League. The United States will face Jamaica in the semifinal with the possibility of a final against Mexico or Panama should they advance.
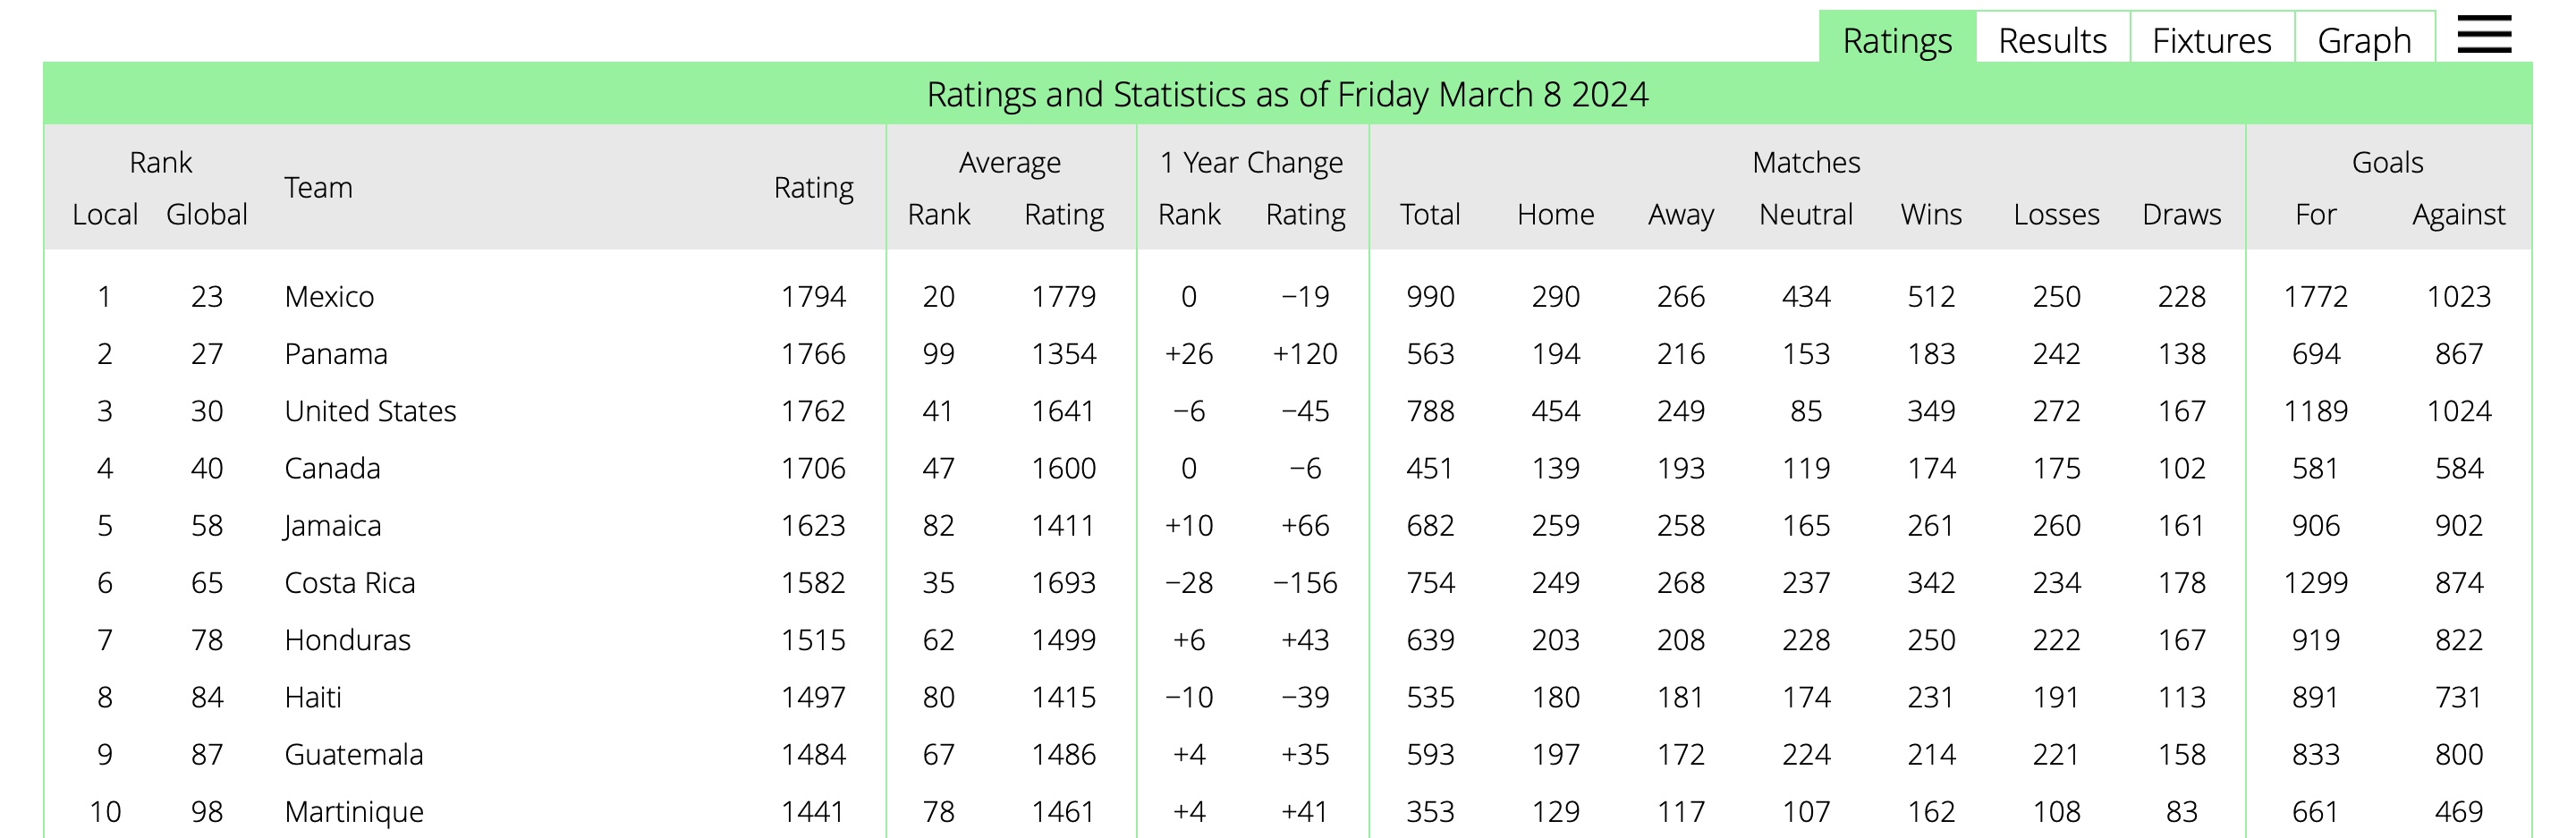
The Elo Ratings for CONCACAF currently rank the United States as the third-best team in the confederation behind both Mexico and Panama. Panama has had a string of excellent results of late, and the United States has had some poor results recently that push them below the Central American side. Jamaica sits far below the U.S. as the fifth best team in the region.
Based on these rating values, the implied probabilities for each team to advance are as follows:
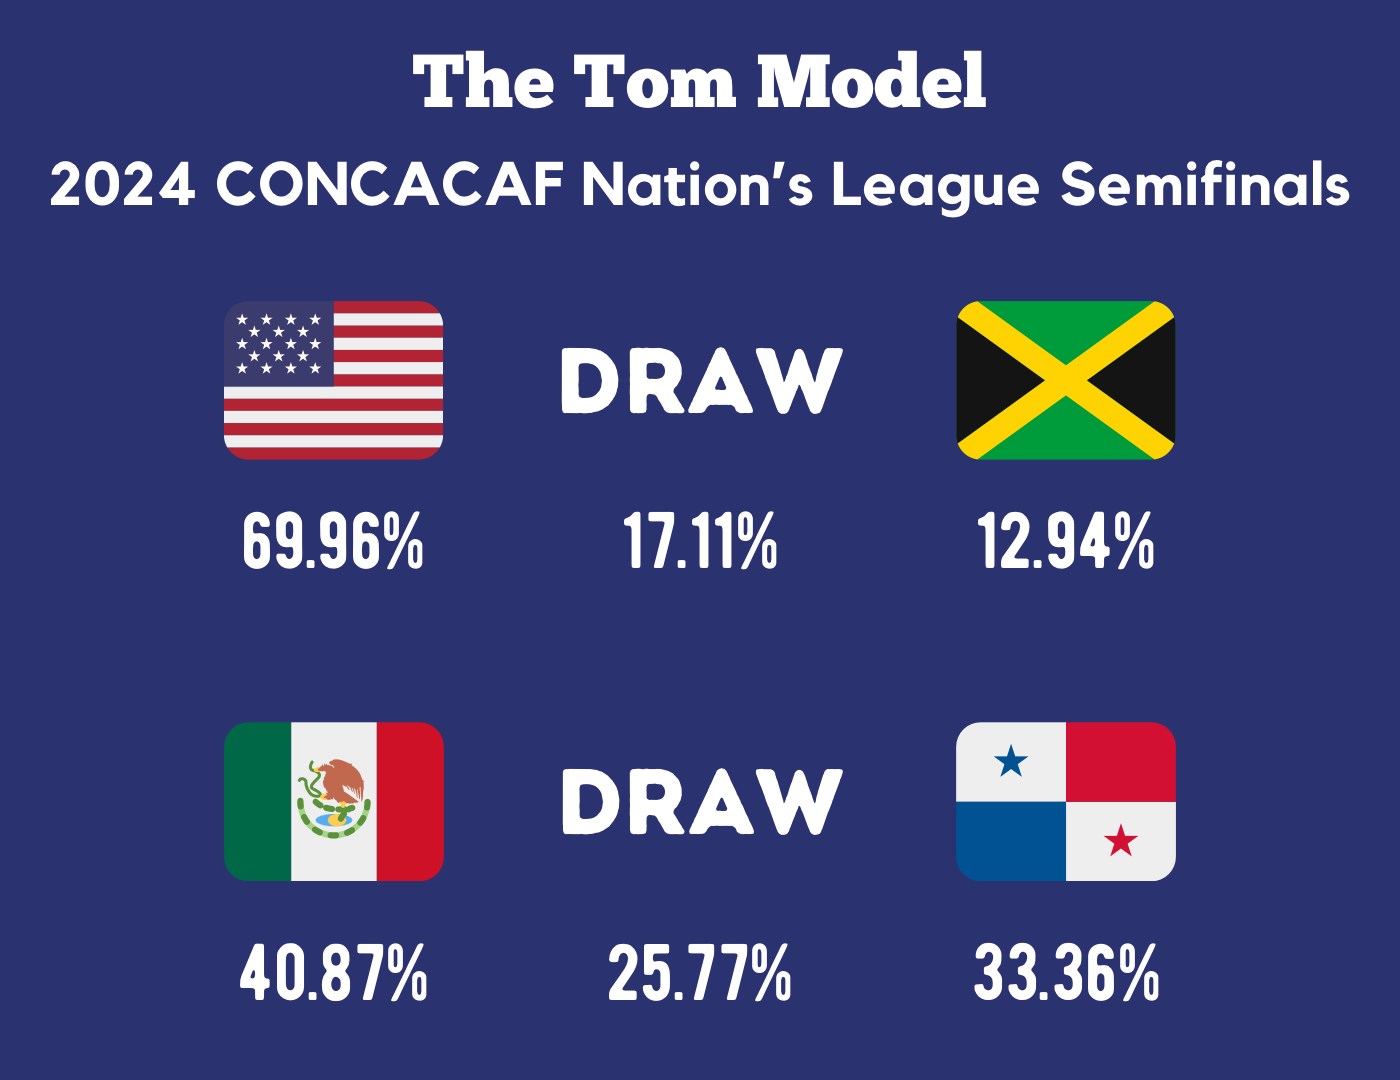
Mexico is being underrated here because the Tom Model does not account for the home field advantage that El Tri will have in Dallas. The USMNT is likely slightly overrated because the newer Jamaican commits from the English Premier League have not had enough time to affect the nation’s Elo Rating yet. In the case of a draw for either match, the Tom Model picks a winner at random with no weighting.
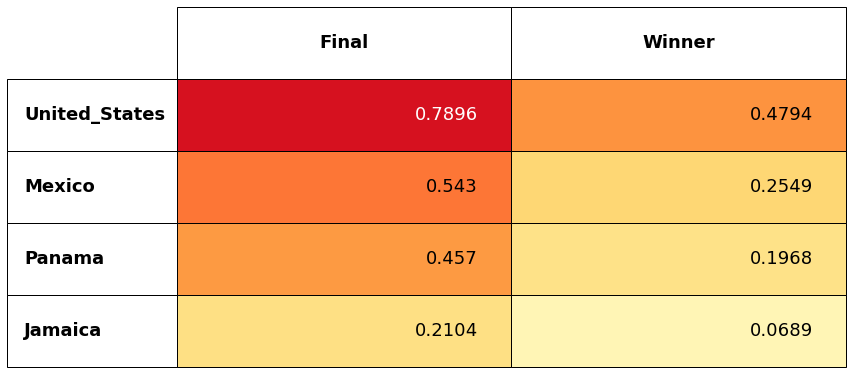
Aggregating all of the results from the Tom Model simulations, we produce a table like the one shown below that presents the odds for every team to advance to each round and to win the tournament. The most likely Final sees the U.S. play Mexico. Because the match will be played in Dallas, the Tom Model has the U.S. favored, but only slightly. Because Mexico reaches the Final so much less often than the U.S., the Americans are the strong favorites to take home the trophy.
While it is nice to see the United States favored so heavily to win their third-consecutive Nation’s League Title, this is an interesting edge case that shows where the Tom Model can be improved. The Tom Model as it currently stands has no way to know that El Tri has a massive fanbase in the United States that can fill any stadium in the country. It only knows that the U.S. is the nominal host, which is typically a massive advantage in soccer matches. If the Tom Model could be updated so that Mexico gets a home field advantage in the United States, then it would cancel out the U.S.’s advantage in the final and give Mexico a better chance to beat Panama. This modified Tom Model would probably show that the U.S. and Mexico have about even odds to lift the trophy.
This wraps up our intro to the Tom Model. Later posts will see updates to World Cup Qualifying around the world. We will also take a look at the odds for every team to take home the Copa America crown later this summer.
If you want more information on the Tom Model or would like to see the GitHub repository where I host my code, please feel free to reach out! Thank you for reading and stay tuned for future pieces.
References
Davidson, R. R. (1970). On extending the Bradley-Terry model to accommodate ties in paired comparison experiments. Journal of the American Statistical Association, 65 (329), 317-328.
https://en.wikipedia.org/wiki/Elo_rating_system